Claude Console adds prompt cache-miss diagnostics with per-message and per-tool token costs
Claude Console now shows which message, system prompt, tool, or model change caused a cache miss and how many tokens it cost. That matters because teams can trace prompt-cost regressions to specific edits instead of debugging cache churn blind.
TL;DR
- ClaudeDevs' product post says Claude Console now attributes prompt cache misses to four specific causes: message changes, system prompt changes, tool changes, and model changes.
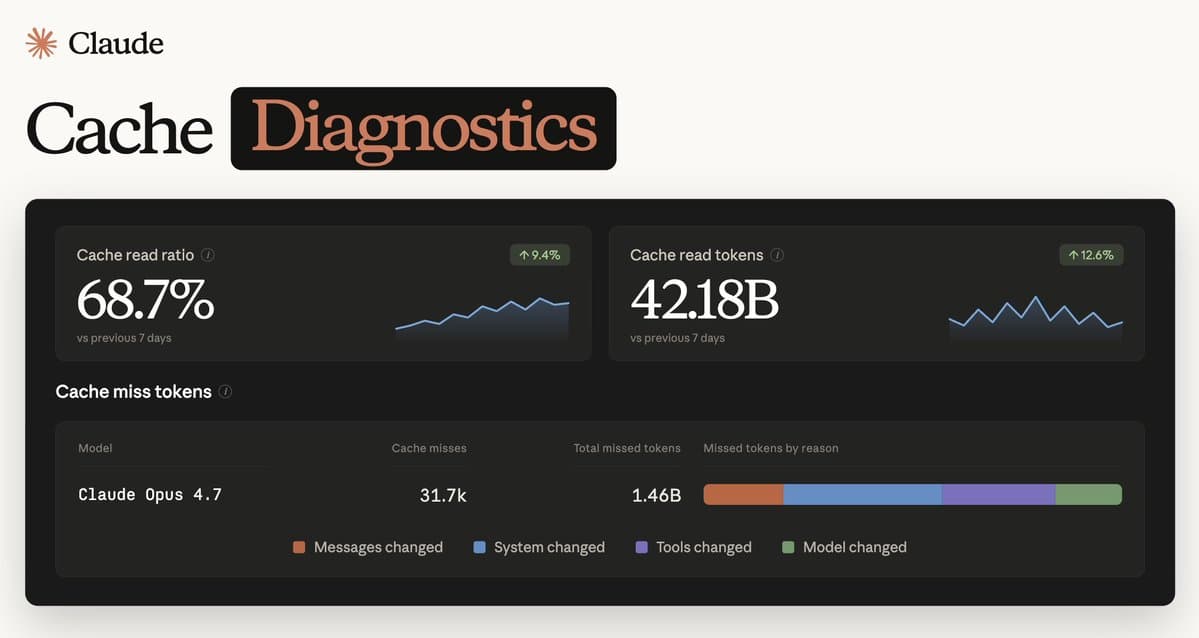
- The new view also shows how many tokens each miss cost, with the launch screenshot surfacing missed-token totals and a reason breakdown instead of a single opaque miss count.
- Claude's cache diagnostics docs and the Claude Console usage page make this a first-party debugging surface inside the existing console, not a separate tracing product.
- RLanceMartin's thread ties the feature to Claude Code workflows, where cache misses can now be investigated directly against console diagnostics instead of inferred from token spend.
You can open the usage dashboard, read the new cache diagnostics docs, and the launch screenshot in ClaudeDevs' post is already more concrete than most observability announcements: it shows cache read ratio, cache read tokens, total missed tokens, and a per-reason bar chart in one panel.
Cache miss reasons
The core addition is attribution. According to ClaudeDevs' post, Claude Console now breaks cache misses into message, system, tool, and model changes, which turns prompt caching from a yes or no metric into a diffable one.
That is the useful bit for teams with long prompts or tool-heavy harnesses. A tool schema tweak and a user-message tweak no longer look identical in the dashboard when they hit token costs.
Cache read metrics
The screenshot in ClaudeDevs' post shows two top-line metrics alongside the miss breakdown: a 68.7 percent cache read ratio and 42.18B cache read tokens, both compared with the previous seven days.
Below that, the same panel shows 31.7k cache misses and 1.46B total missed tokens for Claude Opus 4.7, plus a color-coded chart for why those tokens were missed. That is a better reference view than raw spend charts because the expensive failure mode is visible by category.
Claude Code tie-in
Fix your CC right now and save tokens
1 comments
RLanceMartin explicitly connected the new console view to the bundled claude-api skill in Claude Code, describing a workflow where Claude Code investigates cache misses using the diagnostics as a guide.
A day earlier, a Reddit post in r/ClaudeCode described a separate Claude Code caching issue on local inference, claiming a changing attribution header could invalidate prefix caching on every turn and pointing to Unsloth's Claude Code docs plus the claude-code-cache-fix repository. That does not describe the new console feature itself, but it does show why more granular miss attribution landed with immediate appeal for people debugging token churn in agent-heavy setups.