
NerfBench publishes method for testing Claude Opus 5.5 performance changes
NerfBench's creator publishes a methodology for testing whether Claude Opus 5.5 performance has changed. BridgeMind says test cases cannot be open-sourced and changes within ±10% are normal variance.
TL;DR
- NerfBench now specifies 50 tasks and 150 attempts per session in the creator's methodology announcement.
- Opus 5.5's reported 94.2% remained inside the benchmark's 90% to 110% band, as the original post explicitly acknowledged.
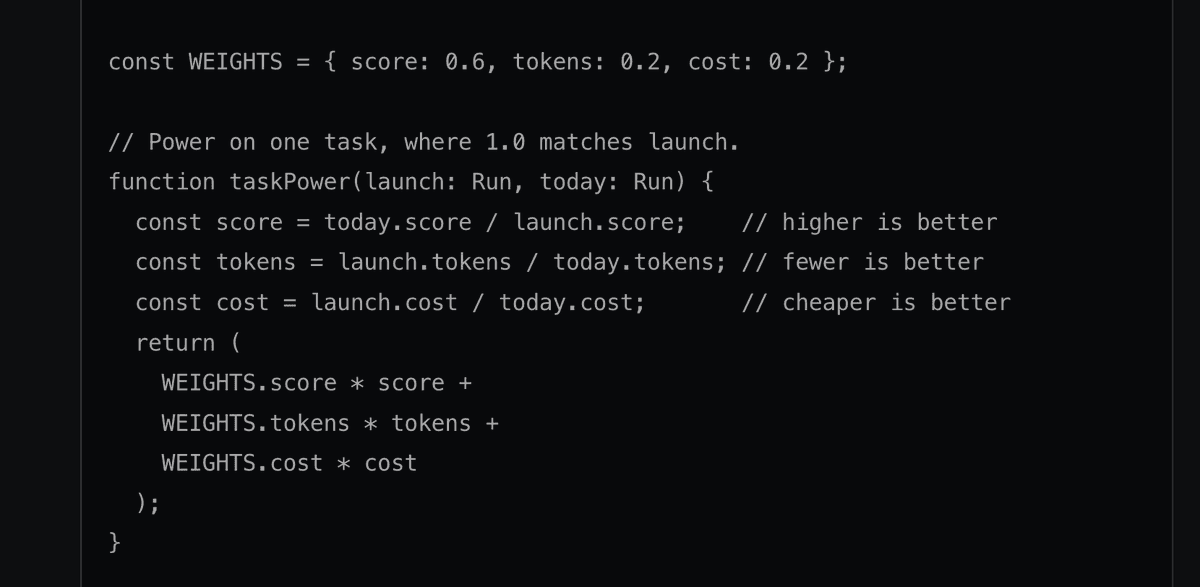
- The headline “power” score mixes correctness, output tokens and cost at 60/20/20 weights in the linked methodology.
- The full prompts, tests and answers remain private; bridgemindai ruled out open-sourcing them in a reply.
Codex's missing cost data produces a 75% correctness, 25% tokens score. The published payment-ledger example requires exact amounts beyond JavaScript's safe integer range.
Opus at 94.2%
Opus 5.5 fell from 103.8% on October 1 to 94.2% on October 2, a 9.6-point slide in its NerfBench history. Its distance below the frozen baseline was smaller: 5.8 points.
Theo asked why the post sounded an alarm over a result classified as normal variance. Bridgemindai said in reply that a large daily move and a normal-variance classification could both be true.
Nine methodology questions
Before the disclosure, Theo asked for nine missing details after reading the original explainer:
- The harnesses used.
- The tasks used.
- How many times each task runs.
- How daily-run variance is identified.
- How bad runs are analyzed for failure causes.
- Which APIs are used.
- How the ±10% band was selected.
- Why tokens and cost receive equal weights and together approach correctness's weight.
- Why tokens are scored separately from cost.
The original explainer, first published September 27, now carries an October 4 update and links to the fuller methodology.
50 tasks
The October 4 methodology specifies eight categories:
- Bug fixing: 15 tasks.
- Code reasoning: 10.
- Code writing: 5.
- Algorithms: 5.
- Strings: 5.
- Testing: 5.
- Security: 3.
- SQL: 2.
That makes 33 code tasks and 17 answer tasks. Every task gets three separate requests, producing 150 graded attempts per session; these repetitions are independent attempts, not retries until something passes.
Every attempt counts equally. Bug fixing consequently contributes more to the result than SQL.
Single-response grading
NerfBench tests single-response performance with no tools and no repository, according to the published method. Its grading and request handling are separate:
- Code: Extract JavaScript and execute it in a separate Node process with permission controls, a near-empty environment, and memory, output and time limits. Every test must pass.
- Answers: Extract the answer, normalize formatting and require an exact match.
- Model failures: Crashes, execution timeouts and wrong results fail the attempt.
- Transport failures: Rate limits, server errors and network timeouts trigger backoff, with up to five request attempts. Unresolved requests leave the session incomplete and unscored.
No model judges another model's response. Saved responses can be regraded after an interruption without requesting a new answer.
Power score
The biggest gotcha is in the arithmetic: cheaper inference can raise “power” while correctness falls. BridgeBench says its session checks flag those cases for review.
- S: Current pass rate divided by reference pass rate, calculated across the suite.
- K: Reference output tokens divided by current output tokens, calculated task by task and averaged.
- C: Reference cost divided by current cost, also calculated task by task and averaged.
- Caps: Each ratio is limited to 0–2, giving an overall score range of 0%–200%.
Failed attempts still contribute tokens and cost. Retried requests do not: only the response that gets graded counts.
Output tokens include reasoning tokens when the provider reports them as output; input tokens are excluded. OpenRouter supplies reported cost, while Claude Code supplies CLI-reported list-price cost, so a price change can move the score without changing answers.
Speed has no weight. The publication explains the preference for correctness and efficiency, but gives no derivation of the exact 60/20/20 weighting.
Provider profiles
The methodology tracks each access path separately and locks its provider, model and effort setting after the first session:
- OpenRouter: Default routing, no pinned upstream provider and no explicit temperature. Returned model and request IDs are saved.
- Claude Code: No tools and none of the operator's local settings.
- Codex: Tools disabled, a separate home folder and an empty working directory. Using a tool anyway fails the attempt.
Each task allows up to 65,536 output tokens. A measurement profile records suite and prompt fingerprints, adapter and runtime versions, CLI versions, output limits, timeouts, concurrency and retry limits; a mismatched profile prevents comparison against the old reference.
The disclosure also answers Theo's questions about chart density:
- One complete 150-attempt session produces one chart point. Smaller quick checks never do.
- The first session becomes the frozen 100% reference, rather than the model's best day.
- Every tracked model gets at least three sessions weekly, with additional sessions when users report degradation.
BridgeBench defines the measured target as the model as served, including routing, system instructions, reasoning settings and output limits.
Two-session confirmation
BridgeBench's explanation of the 10-point band uses an illustrative 70% pass rate. With 150 attempts in both the reference and subsequent session, it estimates chance alone moves power by roughly nine points either way 95% of the time; lower-pass-rate models vary more.
The publication also specifies confirmation rules:
- Two consecutive sessions must fall outside the band on the same side, using the same reference and settings.
- An incomplete intervening session blocks confirmation. Quick checks do not count, and publication requires review.
That expands the creator's earlier statement that anything within ±10% is normal variance.
Private tasks and independent testing
BridgeBench attributes task secrecy to preventing training on the benchmark and benchmark gaming. Its public ledger example is a summary, not the full prompt, hidden fixtures or reference implementation.
Theo proposed spending $10,000 on an alternative benchmark and allowing a qualified third-party audit in his challenge. His proposed terms were:
- If his tests supported meaningful degradation aligned with the viral post, another $10,000 would go to a charity chosen by bridgemindai.
- If his tests supported his criticism, NerfBench would come down and be replaced with an apology page written by him.
Bridgemindai rejected the takedown-and-apology demand in a response, while acknowledging that some methodology questions were fair.
April scope mismatch
Theo also raised an earlier Opus 4.6 comparison. The community note he shared reported two different comparisons:
- Aggregate accuracy: 83.3% on six tasks versus 68.3% on 30 tasks.
- Performance on the six common tasks: 87.6% versus 85.4%, which the note described as suggesting no major change.
October 4 retest
Opus 5.5's next published result was 96.5% on October 4, up 2.3 points from October 2 and still inside the normal band. The updated board listed no tracked model beyond normal variance.
Subscription testing was separately announced as starting “tomorrow” in the creator's reply, extending the planned testing beyond the access paths already described.